GRANVILLE'S 8 RULES OF MOVING AVERAGE

What Is a Moving Average (MA)?In statistics, a moving average is a calculation used to analyze
data points by creating a series of averages of different subsets of the full data set. In
finance, a moving average (MA) is a stock indicator that is commonly used in technical analysis.
The reason for calculating the moving average of a stock is to help smooth out the price data by
creating a constantly updated average price.
There are a few different types of moving
averages that investors commonly use.
Simple moving average (SMA) SMA is calculated by
adding all the data for a specific time period and dividing the total by the number of days. If
XYZ stock closed at 30, 31, 30, 29, and 30 over the last 5 days, the 5-day simple moving average
would be 30 [(30 + 31 + 30 +29 + 30) / 5 ].Exponential moving average (EMA). Also known as a
weighted moving average.EMA assigns greater weight to the most recent data. Many traders prefer
using EMAs because they place more emphasis on the most recent market developments.Centered
moving average. Also known as a triangular moving average, a centered moving average takes price
and time into account by placing the most weight in the middle of the series. This is the least
commonly used type of moving average.
Moving averages can be added on to all types of price
charts (i.e., line, bar, and candlestick), and are also an important component of some other
technical indicators. In terms of when to use moving averages, they can be helpful at any time.
However, they are considered to be particularly useful in upward or downward trending
markets—like this Cryptocurrency Market.
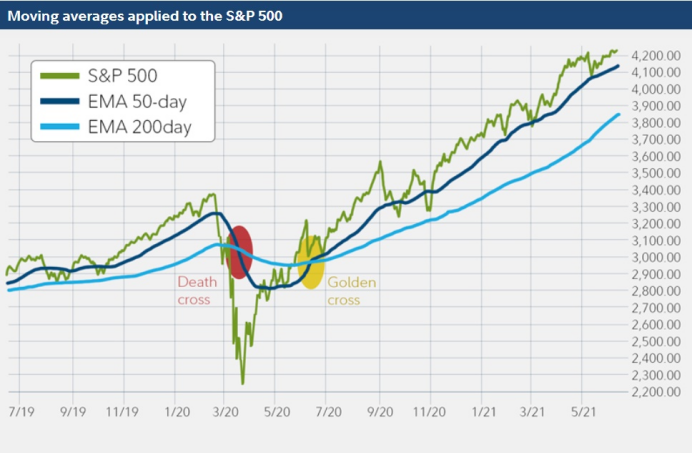
In most trading platforms, you can choose between
different moving average indicators, including a simple or an exponential moving average. You
can also choose the length of time for the moving average. A commonly used setting is to apply a
50-day exponential moving average and a 200-day exponential moving average to a price
chart.Refer to the
S&P 500 Price Chart below: